State of the Markets

This weekend market update holds an extensive review of the weekly and daily status of TrendXplorer in the various markets.

The weekly SPX painted a bullish cross on the 10 and 40 SMA's, on the daily chart the equivalents of the 50 and 200 SMA's a cross is very close, but did not happen (yet?). During the last 10 years every bullish cross was followed by a prolonged period of rising prices. Only in Spring 2002, the bullish cross was soon followed by a bearish one. At that time however the 200 SMA was firmly downsloping, while right now it is fairly flat with some positive bias. Notice on the daily, momentum is waning somewhat and unlike the $DJI, SPX did not take out its July tops.

The Dow did take out its July 2011 double top and the high of this week is only some 34 points under the May 2, 2011 top.

The NDX did take out its high of last July and had follow through during this market week. Notice the steep rise during this last month. What goes up fast goes down fast? The weekly and daily charts show quite some negative divergence.

"Not impossible. Inevitable. Goodbye, Mr. Anderson."

Tomorrow Silver will see its daily 50MA cross the 400MA. It is inevitable! The MA-pair differ only 0.1 point, while the 400MA is rising 0.3 points each day and the 50MA declines 0.1 point. The last time such a down cross occurred was in mid September, 2008. Further the 50, 100, 150 and 200 MA's (not shown on chart) are in bearish alignment. Price is stalling and mayor resistance is building with the both the 50 and 400 MA just overhead. So mr. Anderson, are you going down or do you play your Neo tricks?

In XLF, the 200MA held as resistance. In Gold the non-triggered sell signal is cancelled. NDX shot up, causing a new buy signal to be issued. On the US Dollar notice the 8th touch of the up sloping tendline. TLT is hovering around its 50MA.

Hidden negative divergence in XLF, Gold battling with daily 200MA

While TrendXplorer still has XLF in an uptrend, it is showing hidden negative divergence (see chart). The lower high in price (a hanging man doji) was accompanied by a higher high in momentum and last Friday momentum was waning again. This concurs with the weakness stocks are showing at the moment. Prices stalled and the new buy signal in NDX (not shown) was canceled by a red square (see Trading the Trend for explanation)
With US markets closed today Gold futures retreated a bit, battling with their daily 200MA. Notice the re-sell signal of last Thursday on the second chart. It looks like Gold has found its resistance again.


Implosion of the inverse correlation in the markets?
To measure is to know

A correlation comparison study on USD/EUR, SPX, Gold, Oil, AUD/USD and VIX

The other day a visitor on my blog stated the markets inverse correlation with the US Dollar had pretty much imploded. In the meantime AlbertaRocks also published his peace on this subject: USD - "Inverse" About To Become The Norm
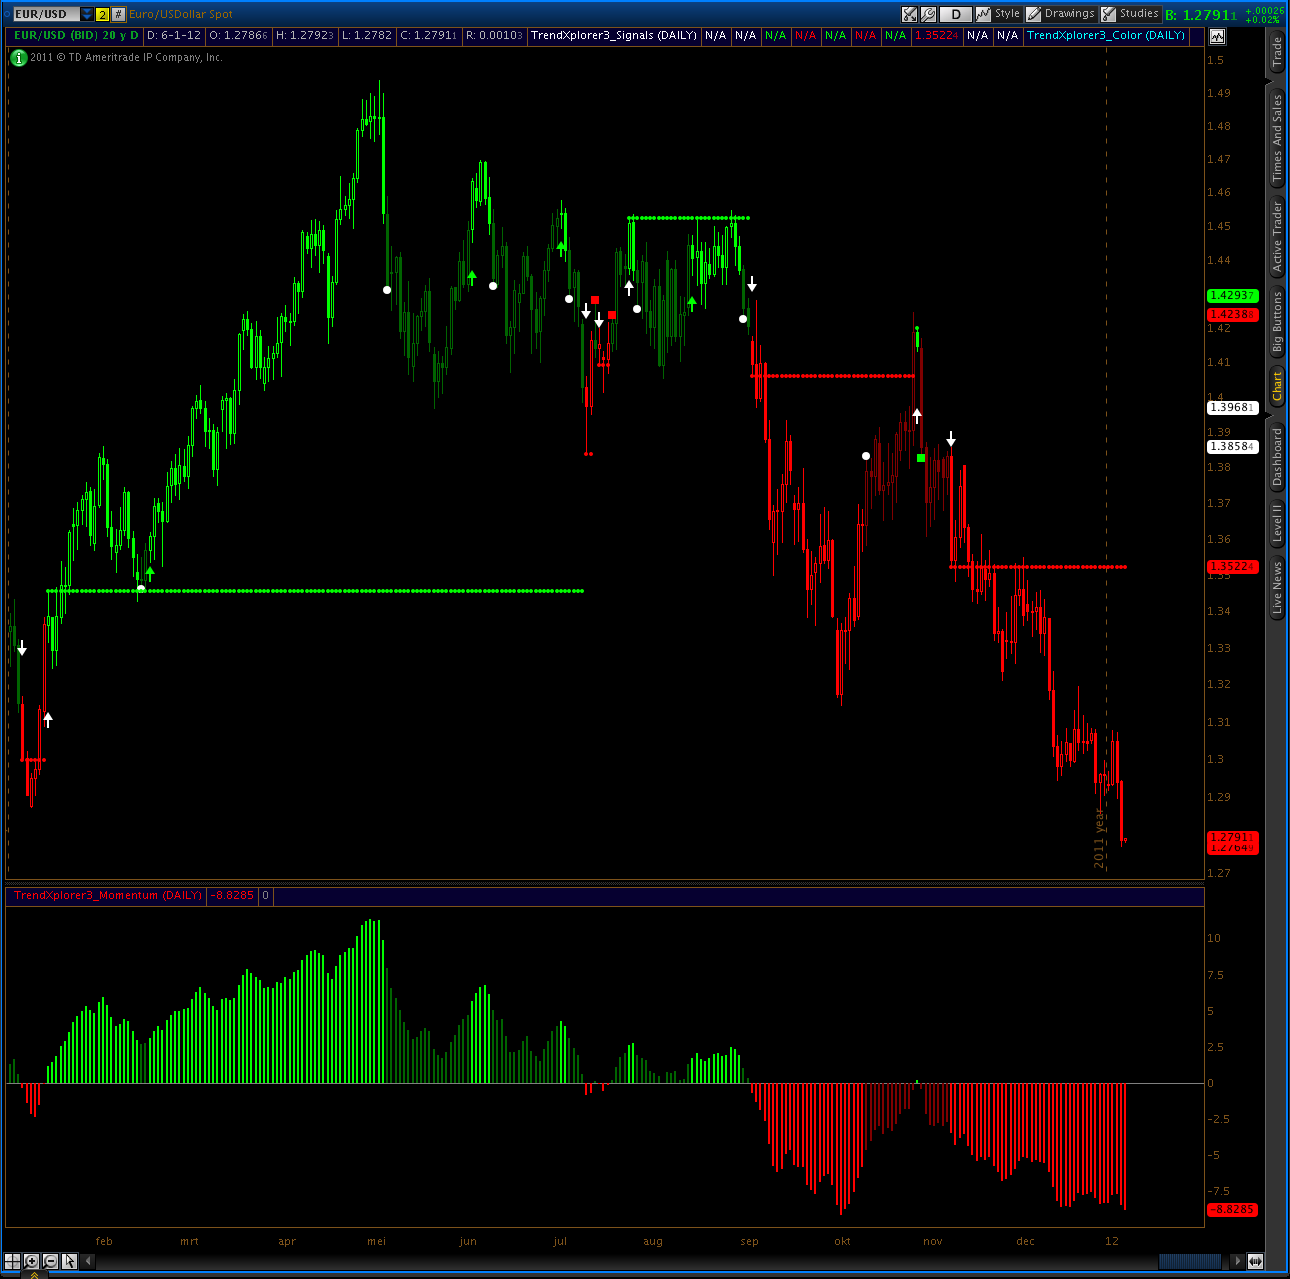
To be able to validate this statement in a better way than eyeballing the charts, I wrote a thinkscript study that compares the trend in a given stock, index or currency against another showing the correlation, be it positive or negative, in a subpane. That is: when both rise or decline in tandem, positive correlation is at hand, signaled by a green flag. Otherwise negative correlation is assumed, signaled by a red flag. Because of data issues I had to use the inverted EUR/USD spot prices as a proxy for the US dollar.

SPX : USD/EUR
My measurements show that on a week to week basis green and red flags fly all over the place in an erratic, chaotic way. On a day to day basis the randomness seems to be even greater. So any meaningful correlation on these timeframes is virtually non existent, neither negative nor positive (see upper subpane on charts).

When correlation is measured by the waning and waxing of the weekly 10-period moving averages (50-period daily moving averages), the most extensive conclusion in my judgement would probably be that there are times when values move in tandem or non-tandem for a while, but both connections and disconnections seem to "just" happen. Whether the markets rise or fall, is of no difference too. And tandems fall apart just as quick as they pair up together, seemingly for no obvious reason.

Only when measured on the larger timeframe of a 40-period moving average (200 days) the quite popular believe that there was inverse correlation until recently turns out to be only partly true. My TOS-charts go back 20 years and until April 2002 positive correlation had the upper hand. Since then inverse correlation took over as the prevailing trend. But notice also during these recent years there are weeks and weeks on stretch with positive correlation.


Hanging man doji day for stocks, oil leaking

Both SPY, DIA, QQQ and IWM printed a hanging man doji on the charts, with a suspicious new buy signal on the QQQ's (see chart). So the rise in stocks is struggling.
UUP was fairly lower, while (of course) its mirror: FXE went higher. Perhaps the most interesting was oil, which took quite a drop (see chart).


Stocks fail to rise, cover signal on SLV

The market was slow, not to mention dull, today. Stocks stalled, in spite (yes!) of a rising US dollar. Only one thing of importance to mention: TrendXplorer issued a cover signal on SLV. GLD is putting its sell signal to the test.

And now something completely different:
Hat tip for DV for being the first donor to this blog. Thanks for your generosity, DV!


[Update: Charts added of SLV and GLD]

Stocks rise on lackluster volume

After a few days of hesitation SPY followed SPX in triggering the buy signal TrendXplorer issued. The rise occurred on low volume though, well below the 50ma. NDX is the last big index that is still in neutral sell territory and on the verge of having is sell signal too. NDX's rise is on higher volume at around the 50ma, but volume in the QQQ's (chart not shown) was low again.


Superimposed studies for thinkorswim

All charts on this blog are made with the award winning thinkDesktop, the charting software provided by thinkorswim (TOS). thinkDesktop allows users to write private studies such as TrendXplorer in "thinkscript". One of the not so widespread options is to use superimposed studies Stockchart users are familiar with. While some quotes such as $CPC unfortunately are not (yet?) available, most are. And those can be superimposed on any pricecharts, be it ratiowise, standard or inverted.

Want to have VIX inverted on your own TOS pricechart with SPX? 

Want the $DJI priced in "real money" as Bob Prechter likes to say?

Heck, why not price AAPL in terms of orange juice, whatever combination seems sensible? Well, as of today every TOS-er can too.

US Dollar looks fatigued: stocks ready to spurt?

The US Dollar has been rising since Oct, 27. Both on the weekly and the daily chart negative divergence is building up indicating exhaustion and a possible near term reversal. For stocks such an occurrence could be a sign for the start of a new rally triggering in SPY the buy signal TrendXplorer issued the first trading day of 2012. Notice that the both the signals on SPY and SH still await confirmation.
(Dollar charts are shown with closing prices only for better distinction.)


Private domain name for TrendXplorer: www.trendxplorer.info

As of today TrendXplorer is located at: www.trendxplorer.info as its top domain name. Please change your bookmarks. BTW, the "old" address indexswingtrader.blogspot.com stays in use too.


Quiet market, Euro drops

Today it looked almost like the markets took the day off, so there is no reason to say much. Except for the Euro/Dollar, it had to take quite a blow. The USD is hitting overhead resistance and knocking at the door to go up. If the correlation of the last couple of years still holds up, this move in the currencies spells trouble for stocks.


About gallows and positive divergence

For the third time in a row SPX painted a hanging man doji on its chart. On the two prior occasions price was heading due south.
SLV noted a positive divergence with follow through during yesterday and the day before. Today SLV stalled a bit, perhaps taking a pause. TrendXplorer colors still bright red, waiting for the white dot first. So no action is needed yet.


SPX: buysignal triggered

Today last weeks buy signal was triggered. We had a solid price bar above the 200MA. Will it pop and drop, like last July or do we get follow through during the rest of this first week of the new year? We'll have to wait and see. Stops can be set just below the green low of last week.

Follow through or reversal?

Following the fake out in the beginning of July, last week TrendXplorer issued its third buy signal in six months time for SPX. Until now none of those signals actually got triggered, they were reversed instead. Notice how price is hugging the 200MA. Furthermore the DJIA even had seven buy signals, all above the 200MA, but none with any follow through. Will this time be different? We just have to wait and see.


2012: TrendXplorer trading

The TrendXplorer Trading Plan is published and can be found under "Trading The Trend".

 
 For everyone: Happy New Year and prosperous trading!