Introducing Hybrid Asset Allocation (HAA)

  • HAA aims to offer retail investors a tactical asset allocation strategy that is both balanced and aggressive at the same time.
  • HAA’s hybrid approach combines traditional dual momentum with canary momentum which results in robust crash protection with low cash-fractions.
  • HAA effectively selects assets only when they are most likely to appreciate.
  • HAA’s ability to obtain positive returns consistently is demonstrated by backtesting the strategy for over 50+ years covering various economic regimes.

Hybrid Asset Allocation (HAA) is a novel approach which combines “traditional” dual momentum with “canary” momentum. Dual momentum is based on the concept of assets price trends and consists of absolute (trend following) and relative (cross-sectional) momentum. In addition to the traditional dual momentum framework HAA adds an extra layer for crash protection at the portfolio level based on a single canary asset in the protective (or canary) universe. HAA allows only for offensive investments when the canary asset is uptrending and switches in full to defensive investments if and for as long as this asset is not uptrending. Interested readers are referred to our paper published on SSRN which offers a comprehensive explanation of the HAA methodology including explanations of the used jargon and abbreviations.


Strategy layout

HAA effectively utilizes the dual momentum framework for harvesting risk premia in financial markets by only allocating capital to assets when they are most likely to appreciate. To this effect three different universes are deployed: a protective, an offensive, and a defensive universe. 

First for early crash warning the trend of the overall market is assessed through a single canary asset, for which we have taken into account the recent (2022) stagflation-like regime with low equity growth and rising yields/inflation, including possible recessions by ‘inverted- yield-curves’ from FED actions like interest hikes and tapering. Hence our choice for HAA’s dedicated canary asset needs to be sensitive not only to rising yields but to rising (expected) inflation too. When the canary momentum is positive, cross-sectional relative strength momentum is used for selecting the best assets with the highest performance while trend-following absolute momentum reduces potential drawdown by replacing best but “bad” (non-positive) risky assets to a safe harbor short-term or intermediate-term treasury bond fund, as is fully the case when canary momentum is “bad”. For all three universes one and the same momentum filter is applied.

The objective of HAA was to design an investment strategy that is both balanced and aggressive at the same time, while specifically aiming for low cash-fractions despite robust crash protection. We had to consider that small top sizes happen to be more aggressive but less balanced, while smaller universes tend to improve the effectiveness of absolute momentum based crash protection. To combine these opposite characteristics, we found a top size of four assets out of four different financial asset-classes with two assets per class for broad diversification to be a good compromise. 

Support message for users of the PAA/GPM spreadsheet

[Updated] Due to a change in the placement of OHLC price data in Tiingo's feed, version 4.0 of the stand alone Excel spreadsheet should no longer be used! In beta version 5.0 the issue has been fixed by JH. Great job!


Exploring Smart Leverage: DAA on Steroids

  • The constant leverage myth is busted: there is no spoon natural decay. 
  • DAA’s fast protective momentum approach successfully detects lower volatility regimes with higher streak potential. 
  • Smart leverage through a clever separation of signals and trades can achieve considerable outperformance even on a risk adjusted basis.

Popular belief that constant leveraging results in decay over time is a myth. Michael Gayed and Charles Bilello busted the myth in their 2016 Dow Award winning paper “Leverage for the Long Run”. Their research shows that daily re-leveraging is not without risk. At times the act of re-leveraging can even be mathematically destructive. Yet the source of that risk does not come from some inherent form of natural decay. The authors single out high volatility and seesawing action as the (real) enemies of leverage, while low volatility and streaks in performance are its friends.


As stated in the paper daily re-leveraging combined with high volatility creates compounding issues, often referred to as the “constant leverage trap”. A systematic way of identifying lower volatility regimes with higher streak potential is key for achieving outperformance through smart leverage. Expanding on the authors application of moving averages for identifying those conditions, in the following article smart leverage is explored using the DAA framework with its fast 13612W protective momentum approach with a dedicated two-asset canary universe. 

When the stock market is in an uptrend - positive 13612W momentum for all canary assets - favorable conditions for leveraged stock positions are assumed targeting positive streaks in performance. When the stock market is in a downtrend - negative 13612W momentum for one or more of the canary assets - a rise in volatility is expected and a (relatively) safe Treasury bond position is acquired to avoid the constant leverage trap for stocks.

On top of DAA’s dedicated 13612W protective momentum deployment for detecting favorable conditions for leverage, the smart leverage approach incorporates a clever separation of signals and trades. As proposed by Matthias Koch, a quant from Germany, non-leveraged asset universes are used for signaling momentum based position sizing while universes that hold a limited number of matching leveraged funds are used for actual trading.

Announcing Defensive Asset Allocation (DAA)

  • Defensive Asset Allocation (DAA) builds on the framework designed for Vigilant Asset Allocation (VAA)
  • For DAA the need for crash protection is quantified using a separate “canary” universe instead of the full investment universe as with VAA
  • DAA leads to lower out-of-market allocations and hence improves the tracking error due to higher in-the-market-rates


In our brand new SSRN-paper “Breadth Momentum and the Canary Universe: Defensive Asset Allocation (DAA)” we improve on our Vigilant Asset Allocation (VAA, see post) by the introduction of a separate “canary” universe for signaling the need for crash protection, using the concept of breadth momentum (see VAA). This protective universe functions as an early warning system similar to the canary in the coal mine back in the day. For DAA the amount of cash is governed by the number of canary assets with negative momentum. The risky part is still based on relative momentum, just like VAA. The resulting investment strategy is called Defensive Assets Allocation (DAA). The aim of DAA is to lower the average cash (or bond) fraction while keeping nearly the same degree of crash protection as with VAA.

Using a very simple model from 1925 to 1970 with only the S&P 500 total return index as investment asset, we arrive at a two-asset canary universe (VWO and BND) combined with a protective B2 breadth momentum setting, which defines DAA’s core elements.

The DAA concept turns out to be quite effective for nearly all four universes examined in our VAA-paper from 1971 to 2018. The average cash fraction of DAA is often less than half that of VAA’s (below 30% instead of nearly 60%), while return and risk are similar and for recent years even better. Deploying a separate “canary” universe for signaling the need for crash protection also improves the tracking error with respect to the passive (buy-and-hold) benchmark due to higher in-the-market-rates than with VAA. The separate “canary” universe also limits turnover. This makes DAA less sensitive for rising cash (or bond) yields, which is key in view of recent low rates.

To crystallize the DAA concept:
  1. When both canary assets VWO and BND register negative 13612W momentum, invest 100% in the single best bond of the cash universe;
  2. When only one of the canary assets VWO or BND registers negative momentum, allocate 50% in the top half of the best risky assets, while applying equal weights, and invest the remaining 50% in the best bond of the cash universe;
  3. When none of canary assets VWO and BND register negative momentum, indicating the risk of a crash is deemed low, invest 100% in the full top risky assets, again applying equal weights. 

Presenting the Keller Ratio


  • Many traditional return to risk measures are not apt for intuitive interpretation
  • The Keller ratio is expressed as an adjusted return and therefore easy to interpret
  • The Keller ratio allows for strategy selection optimally aligned with an investor’s risk appetite

In our VAA-paper we introduced a new metric for assessing a portfolio’s equity line in terms of the reward to risk relationship: return adjusted for drawdown (RAD). We did choose RAD above the usual risk measures like the Sharpe and the MAR ratios (Sharpe: return divided by volatility, MAR: return divided by maximum drawdown), because most retail investors commonly identify true risk with maximum drawdown over volatility. Since RAD is an adjusted return, its interpretation is similar to any return (a simple percentage). For this reason we prefer RAD over MAR, which as such is just a numeric value with little context.

Frankly, albeit return adjusted for drawdown states exactly what RAD is all about, it is quite a mouthful. Therefore, and not only because RAD is his brainchild, but also to commemorate Wouter Keller’s contributions to the TAA literature (FAA, MAA, CAA, EAA, PAA, and VAA; see SSRN) it only seems fitting to accredit the return adjusted for drawdown indicator with his name. So henceforward RAD is to be named the “Keller ratio”.

Celebrating Wouter Keller's 70th birth year

Every investor with skin in the game acknowledges a large portfolio drawdown as the ultimate investing risk. Large drawdowns are devastating to long term returns. For example, during the 2008 subprime crisis the S&P 500 Total Return index crashed over 50% in approximately 1.5 years from its late 2007 peak, needing 3 years for recovery to breakeven. This left Buy & Hold investors without any positive returns for over nearly five years, not to speak of the excruciating anxiety along the way.

The following table illustrates how severe drawdowns wreak havoc to portfolio performance. Total loss of principal is the biggest risk of all.


Matrix Iterations for Adaptive Asset Allocation


  • Adaptive Asset Allocation (AAA) is based on the Nobel Prize winning portfolio theory of Markowitz (1952)
  • AAA combines asset’s momentum, volatilities, and cross-correlations for building diversified investment portfolios
  • In a tactical application AAA exploits momentum for crash detection and results in consistent returns at mitigated risk levels

Actually, their encounter was coincidental. The fortuitous conversation between a stockbroker and a young mathematician in the early 1950’s proved to be seminal. After the stockbroker learned about the mathematician’s expertise, linear programming and utility maximization, and its real-life applications, he suggested to apply the math to financial portfolios. Fast-forwarding four decades, in 1990 Harry Markowitz shared the Nobel Prize in Economics for his pioneering work on Modern Portfolio Theory (MPT).

Matrix rain animation courtesy TheCodePlayer.
AniGif created with Gif Brewery.

The mathematical framework of MPT combines asset’s expected returns, volatilities, and cross-correlations for assembling well-balanced and diversified portfolios while maximizing the expected return for a given level of risk. Its key proposition: for a multi asset portfolio returns can be maximized for a given level of risk. Likewise, risk can be minimized for a desired level of return. With the efficient frontier as its famous graphical depiction (see graph below), Markowitz’ MPT is also known as “mean-variance analysis” since the “mean” or expected return is maximized given a certain level of risk, defined as the portfolio variance (which is volatility squared).


Efficient Frontier

MPT proposes a mathematical framework how investors can reduce overall risk while maximizing return by holding a diversified portfolio of non-correlated asset classes. Instead of looking at the risk-return characteristics of each single asset class, MPT assesses risk and return as cumulative factors for the portfolio as a whole. The Markowitz Efficient Frontier is the graphical depiction of the collection of portfolios that offer the lowest risk for a given level of return. In an excellent video Arif Irfanullah explains in merely 3 minutes how the efficient frontier represents the set of portfolios that will give the highest return at each level of risk or the lowest risk for each level of return (highly recommended).

To illustrate key elements of MPT, let’s bring to bear the top selection from a diversified investment universe SPY, EWJ, VGK, EEM, and DBC (both the full universe population as well as the selection methodology are explained in the next section).

The portfolio concept under consideration for this contribution is the long only minimum variance portfolio without leverage, located at the magenta dot on the outer left side of the purple portfolio cloud (see statistics in bold font in the table below the following graph). For this special case portfolio risk is minimized for all feasible long only combinations. To localize this particular portfolio an Adaptive Asset Allocation (AAA) approach is applied. Please note the purple long only portfolio cloud is only a subset of the full unconstrained long/short portfolio space demarcated by the blue portfolio envelop hyperbola.

Speed readers may jump to the next section, others please bear with me while painting the full picture.

Update For Global Equities Momentum Excel VBA

By popular demand a new beta update is available for the Global Equities Momentum Excel VBA spreadsheet. The new edition sources data from Tiingo's. Following the same work flow as before, the spreadsheet allows to backtest Gary Antonacci's popular GEM strategy (see post).

GEM with mutual funds for longer historical backtest
NB! Backtested results do not reflect actual trading. Furthermore, trading costs, slippage, and taxes are disregarded. Results are therefore purely hypothetical. Terms and conditions apply.
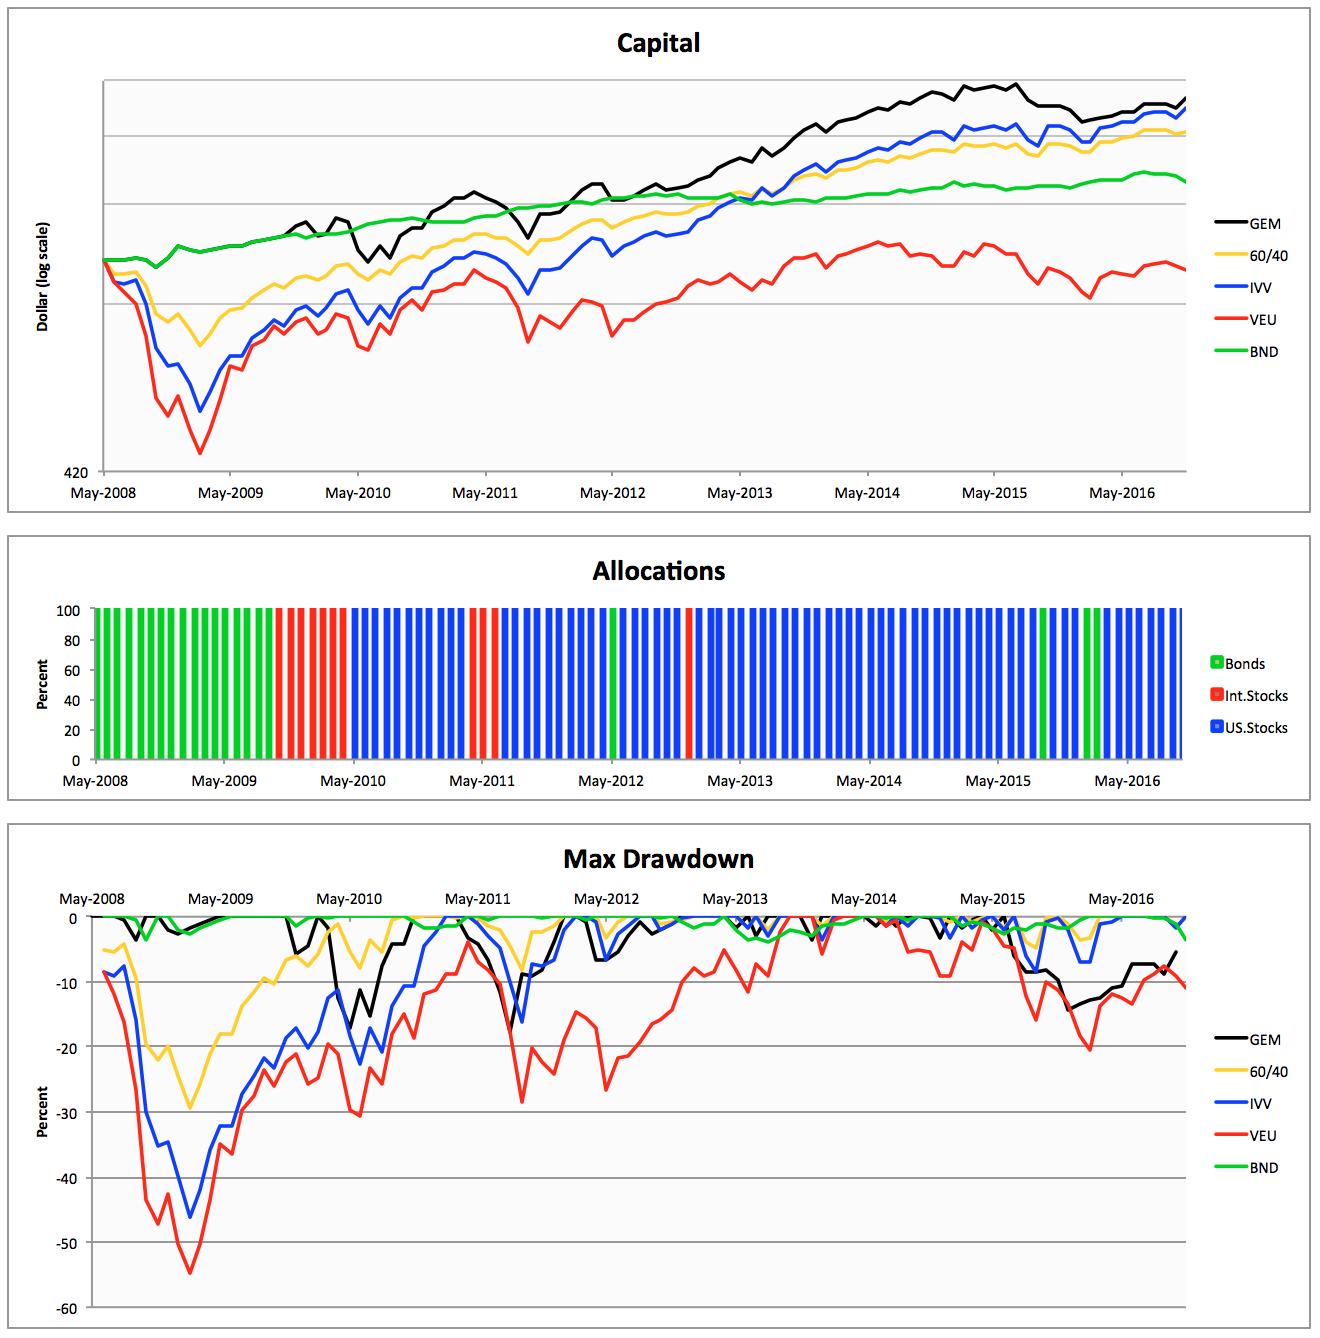
Next to some bug fixes a new pie chart and an annual returns table have been added to the spreadsheet. The pie chart shows the average allocations over the test periode. And the annual returns table specifies GEM's annual returns along with those of the underlying components and the classical 60/40 benchmark.

Strategy Signals Powered By Tiingo's

As the new kid on the block, Tiingo is shaking up the data community. Tiingo offers Freemium access to high quality data for an extensive collection covering the full historical record. Starting today historical dividend adjusted data for the Strategy Signals page is sourced from Tiingo's, with delayed current day's NYSE data grabbed "real time" from Google Finance.


For improved performance a newly designed dedicated backend caches updates from Tiingo's data servers, and operates as on-demand feed for the various Strategy Signal tables.


Tiingo's Freemium service consists of two tailored plans: a free basic service and a power service for $10/m. For details see Tiingo's Pricing page.


Breadth Momentum and Vigilant Asset Allocation (VAA)


  • Breadth momentum extends traditional absolute momentum approaches for crash protection.
  • Breadth momentum quantifies risk at the universe level by the number of assets with non-positive momentum relative to a breadth protection threshold.
  • Vigilant Asset Allocation matches breadth momentum with a responsive momentum filter for targeting offensive annual returns with defensive crash protection.


Vigilant Asset Allocation (VAA) is a dual-momentum based investment strategy with a vigorous crash protection and a fast momentum filter. Dual momentum combines absolute (trend following) and relative (cross-sectional) momentum. Contrary to the traditional dual momentum approaches with crash protection through trend following on the asset level, in VAA risk is quantified at the universe level. For superior protection the VAA cash fraction equals the number of assets with non-positive momentum relative to a breadth protection threshold. The combination of breadth momentum with a responsive filter for measuring dual momentum results in a granular crash indicator that allows for targeting offensive annual returns while offering defensive tail risk protection. The VAA methodology is comprehensively explained in our paper published on SSRN


The VAA recipe
  1. Given a top selection T and a breadth protection threshold B, for each month:
  2. Compute 13612W momentum for each asset
  3. Pick the best performing assets in the “risk-on” universe as top T
  4. Pick the best asset in the “risk-off” universe as safety asset for “cash”
  5. Compute the number of assets with non-positive momentum in the “risk-on” universe (b)
  6. Compute b/B and round down to multiples of 1/T as “cash fraction” CF for “easy trading”
  7. Replace CF of top T by “cash” asset as selected in step 3

13612W momentum filter

In the dual momentum frame work cross-sectional or relative strength momentum is applied for picking the best performing assets for top selection while absolute momentum is utilized to establish whether or not an asset is an uptrend or downtrend (trend following). Different momentum filters are in vogue, like Antonacci’s 12-month return (RET12) for GEM, Keller’s price relative to its 12-month simple moving average (SMA12) for PAA, or Faber’s averaged momentum over the past 1, 3, 6, and 12 months (13612) for GTAA. For VAA we developed a new momentum filter: a variant of the 13612 filter, but now with an even faster response curve by using the average annualized returns over the past 1, 3, 6, and 12 months (13612W). Our 13612W filter has the following composition:
13612W = ( 12 * r1 + 4 * r3 + 2 * r6 + 1 * r12 ) / 4, with rt = p0/pt - 1 where pt equals price p with a t-month lag 
This results in monthly return weights for p0/p1, p1/p2, …, p11/p12 of 19, 7, 7, 3, 3, 3, 1, 1, 1, 1, 1, 1, respectively. Notice that our responsive 13612W filter gives a weight of 40% (19/48) to the return over the most recent month as compared to 8% (RET12), 15% (SMA12), and 18% (13612). The following graphic crystallizes the various weighting schemes for the mentioned momentum filters.


Within the VAA frame work our 13612W filter is applied for both relative and absolute momentum.

On The Lookout For Better Data

[Revised: Originally this post was about sourcing data from Quandl's premium QuoteMedia EOD service ($$$). Due to the migration to Tiingo's as preferred data supplier for the Strategy Signals the contents have become obsolete. This entry is now solely maintained as anchor for the contributions in the comment section below.]

Yahoo Finance API Ceased Working

Unfortunately this week the Yahoo Finance team changed the functionality of their financial data service. Apart from modifying the construction of the download link, the order and contents of the supported data fields have been altered too. As of writing support of total return data has been suspended.


Regretfully, as a result both the Excel VBA spreadsheets and the Google Sheets on the Strategy Signals page have stopped functioning. Until further notice I have no other choice but to discontinue these services from the blog.

Thank you for your understanding and please share your thoughts in the comment section below on fixes or alternative download sources.

For more information see the Yahoo Help Community.

Index Mapping For ETF Proxies

In order to present results as realistic as possible in our PAA-paper, we constructed long-term end-of-month data series for popular ETF proxies, like SPY, GLD and TLT (see paper appendix on SSRN). All data series start December 1969. For the pre-inception history, the proxies are derived from suitable indices. As part of a complete revision of the long-term data set, we recently improved the construction of the data series by mapping the underlying index through a linear formula to arrive at the best fit over the life span of the ETF to be replicated. The construction process is demonstrated below for EFA. The link to an example spreadsheet with all the necessary calculations is published at the end of this post.


EFA seeks to track the investment results of the MSCI EAFE index which is composed of large- and mid-capitalization developed market equities, excluding the U.S. and Canada. The index data is available as free download from the MSCI website. Comparing EFA’s historical data record against the various index levels supported by MSCI like Price, Gross, Net, reveals the MSCI EAFE Net index as underlying index. Historical dividend adjusted data for EFA itself is offered by Yahoo Finance, also for free. For constructing a long-term EFA proxy the data from both sources is required.

With the data readily available in Excel, the next step is to derive the data for the ETF-proxy from the underlying index for the In-Sample (IS) period. The goal is to map the underlying to arrive at the best fit over the life span (=IS) of the ETF through a linear formula: r+ = b * r + a, where “r” is the return of the index and “r+” is the return for the proxy. The values for the coefficients “a” and “b” are determined through Excel’s Solver add-in by minimizing the unexplained sum of squared deviations for the return series of EFA and the ETF-proxy.


After Solver finishes the calculation cycles, the found coefficients result in high R-Squared and correlation readings.

Ho, Ho, Ho: Excel VBA For Global Equities Momentum

Just in time for Santa! Based again on a foundation by InvestExcel, Denis Bergemann collaborated with me on another Excel VBA project covering Gary Antonacci's popular Global Equities Momentum (GEM).


The VBA driven Excel spreadsheet follows the official rules for GEM (see here) and allows you to select your preferred US and International stocks fund. This applies also for the out-of-market bond fund and for the proxy fund for observing the risk free rate. The lookback parameter for both relative and absolute momentum is user adjustable.

[Update] In the latest edition of the spreadsheet [v3], the widely used 60/40 benchmark is depicted as a reference point. The 60/40 portfolio holds 60% equities and 40% bonds with monthly rebalancing. In the spreadsheet the 60/40 mix is composed of the US stocks fund and the out-of-market bond fund.

Results for both the GEM and 60/40 portfolios as well as the separate components are presented in tabular and graphical format.


Flexing VBA For Quants (And Everyone Else)

Update
Due to a change in the placement of OHLC price data in Tiingo's feed, version 4.0 of the stand alone Excel spreadsheet should no longer be used! In the meantime JH has fixed the issue, which is available as beta version 5.0. Thanks JH, great job!


Would it not be great to have the models for Protective Asset Allocation (PAA) and Global Protective Momentum (GPM) in Excel, so you can run your own backtests without AmiBroker? And not being limited to a pre-defined universe? Actually, now you can.


Based on a foundation by InvestExel, Denis Bergemann from Germany collaborated with me in developing an Excel spreadsheet that allows you to select your preferred risk-on and risk-off assets, set backtest parameters to your liking and review results by their statistics as well as in graphical format.


Prospecting Dual Momentum With GEM

  • Gary Antonacci popularized dual momentum with an effective and simple approach for dynamic asset allocation: Global Equities Momentum (GEM).
  • Using simulated ETF data series, GEM’s performance over past market conditions can be approximated.
  • For longer investment horizons GEM’s implementation with ETFs obtained positive returns with high consistency.
After winning first place in 2012 in the NAAIM Wagner competition, Gary Antonacci popularized his momentum investing approach in the award winning book “Dual Momentum Investing”.


In his book Antonacci makes a strong case for combining relative strength price momentum with trend following absolute momentum. The first 90 pages are a comprehensive overview, introducing the “premier market anomaly”,  describing the history of momentum research and its early practitioners, behavioristics and lots of other interesting themes. Frankly, these pages alone make the book a must read, not least due to the conversational, at times even playful tone of Antonacci’s light pen.

At the center of the book lies the chapter covering Global Equities Momentum (GEM), where Antonacci explains the mechanics of the dual momentum approach for dynamic asset allocation. GEM is quite brilliant in its simplicity: a 12-month lookback for both absolute and relative momentum combined with just three asset classes, are all of GEM’s components.

Both in his book and on his website, Antonacci presents the Global Equities Momentum (GEM) approach with non-tradable total return index data. Going back as far as the seventies has the benefit of incorporating a rising yields decade too. Therefore, to get insight into GEM’s long-term performance with today’s ETFs, index based simulated total return proxies are required. By applying GEM’s dynamic asset allocation to such simulated ETFs, the practitioner may get a good impression (nothing more) of GEM’s “real” performance during past market conditions. Before doing so, first GEM’s performance with index data will be replicated to validate the accuracy of the presentation in this contribution.

Noteworthy, the rules often shared for GEM, derived from the flow chart on page 101, are not the official GEM rules. Actually the flow chart along with the corresponding instructions on page 112 is only a simplified way to determine GEM’s allocations for those using a website like PerfCharts to get their signals. However, when doing calculations with a charting program like AmiBroker, the instructions on page 98 are to be adhered instead.

AllocateSmartly


Launched only recently, AllocateSmartly.com tracks the industry’s best tactical asset allocation strategies with thorough, up-to-date backtests. As of writing 16 (sub) strategies are tracked and benchmarked on near real-time basis. All of the tracked strategies are both quantitative and systematic, meaning well-defined mathematical rules govern exactly when and what to trade. Among the featured strategies are GEM, GTAA, EAA and PAA. Take the platform for a test drive with a free limited membership or sign up for full membership to access all the neat features.


Disclaimer: Signing up to AllocateSmartly.com through my blog provides support for my work.

Deciphering Correlation Hedged Momentum

In a new SeekingAlpha contribution we combine PAA’s protective multi-market breadth approach with a generalized momentum metric based on correlation hedged returns. The resulting model is called Generalized Protective Momentum (GPM). In this blogpost the correlation hedge is deciphered.


The correlation hedge is a simplified version of Keller and Butler’s EAA-formula (see paper or primer). For GPM we only use return and correlation information as momentum metric. We do so with two variations:
  • GPMxM: the correlation multiplied return metric ri * ( 1 – ci )
  • GPMxF: the correlation fractioned return metric ri / ( 1 + ci )
where x is the degree of crash protection, ri is the average return of asset i over 1, 3, 6 and 12 months, and ci the 12-month correlation of asset i with the equal weighted “risky” investment universe. The correlation multiplier ( 1 – ci ) is based on the EAA-model, the correlation fraction 1 / ( 1 + ci ) was recently suggested by Wouter Keller. For the mechanics of the crash protection algorithm, see the PAA-post.

In the graph below, the two correlation hedge variations are painted.


Introducing Protective Asset Allocation

Protective Asset Allocation (PAA) is a new provident long only tactical investment strategy that combines a dual momentum approach with a vigorous capital preservation routine. The key elements of PAA are:
  • dual momentum based timing and selection mechanism
  • innovative c(r)ash protection routine through protective momentum
  • support for separate “risk-on” and “risk-off" universes
Each of these building blocks will be explained quite comprehensively followed by a detailed comparative backtest covering 45 years (Dec. 1970 – Dec. 2015). But first be ready for a truckload of conceptual particularities ;-)


In our quest for a yield neutral absolute return performance strategy Wouter Keller and I developed PAA (long only) with its innovative protective momentum approach for capital preservation in times of market turmoil. The interested reader might consider reading our PAA-paper on SSRN too.

PAA exploits the well-defined momentum phenomenon: the empirically observed tendency for asset prices to keep moving in the same direction. By applying PAA to a broad diversified global universe of sufficiently uncorrelated ETFs, PAA will auto-detect bull trends that emerge. Meanwhile protective momentum keeps guard over global market-breadth to adjust the “equity” : “cash” spread of the portfolio. And when trends shift, PAA catches the change and adapts, be it bullish or bearish. In doing so PAA is purely mechanical, so there is no need second guessing market conditions nor predicting trends. PAA is capable of delivering absolute return performance with 1-year-rolling-return win rates of more than 95% (R1yWin>0%) and 99% (R1yWin>-5%).

Equity chart of the PAA strategy demonstrating high return/risk performance

Portfolio Level Monte Carlo Analysis

Following up on the prior Strategy Stress Testing post: with the release of AmiBroker version 6.10.0 a new Monte Carlo mode has come available for simulating portfolio equity changes. Instead of randomizing the trade list, the new mode uses bar-per-bar percent equity changes at the portfolio level to generate permutations. Consequently cross-sectional correlations are preserved. According to AmiBroker’s developer, the new method is perfectly fine for multiple overlapped positions, provided the number of bar-per-bar equity changes is sufficiently large (> 100).


The portfolio level Monte Carlo simulation is controlled by a couple of new SetOption fields which allow for AFL implementation right into the strategy code:
The Monte Carlo Portfolio Analysis code is suitable for copy/paste inside a rotational model like the familair Simple GMR code attached to the prior Monte Carlo post. However, my preferred method is to save the code as a separate file for inclusion in strategy models by calling the #include command: