Ho, Ho, Ho: Excel VBA For Global Equities Momentum

Just in time for Santa! Based again on a foundation by InvestExcel, Denis Bergemann collaborated with me on another Excel VBA project covering Gary Antonacci's popular Global Equities Momentum (GEM).


The VBA driven Excel spreadsheet follows the official rules for GEM (see here) and allows you to select your preferred US and International stocks fund. This applies also for the out-of-market bond fund and for the proxy fund for observing the risk free rate. The lookback parameter for both relative and absolute momentum is user adjustable.

[Update] In the latest edition of the spreadsheet [v3], the widely used 60/40 benchmark is depicted as a reference point. The 60/40 portfolio holds 60% equities and 40% bonds with monthly rebalancing. In the spreadsheet the 60/40 mix is composed of the US stocks fund and the out-of-market bond fund.

Results for both the GEM and 60/40 portfolios as well as the separate components are presented in tabular and graphical format.


Flexing VBA For Quants (And Everyone Else)

Update
Due to a change in the placement of OHLC price data in Tiingo's feed, version 4.0 of the stand alone Excel spreadsheet should no longer be used! In the meantime JH has fixed the issue, which is available as beta version 5.0. Thanks JH, great job!


Would it not be great to have the models for Protective Asset Allocation (PAA) and Global Protective Momentum (GPM) in Excel, so you can run your own backtests without AmiBroker? And not being limited to a pre-defined universe? Actually, now you can.


Based on a foundation by InvestExel, Denis Bergemann from Germany collaborated with me in developing an Excel spreadsheet that allows you to select your preferred risk-on and risk-off assets, set backtest parameters to your liking and review results by their statistics as well as in graphical format.


Prospecting Dual Momentum With GEM

  • Gary Antonacci popularized dual momentum with an effective and simple approach for dynamic asset allocation: Global Equities Momentum (GEM).
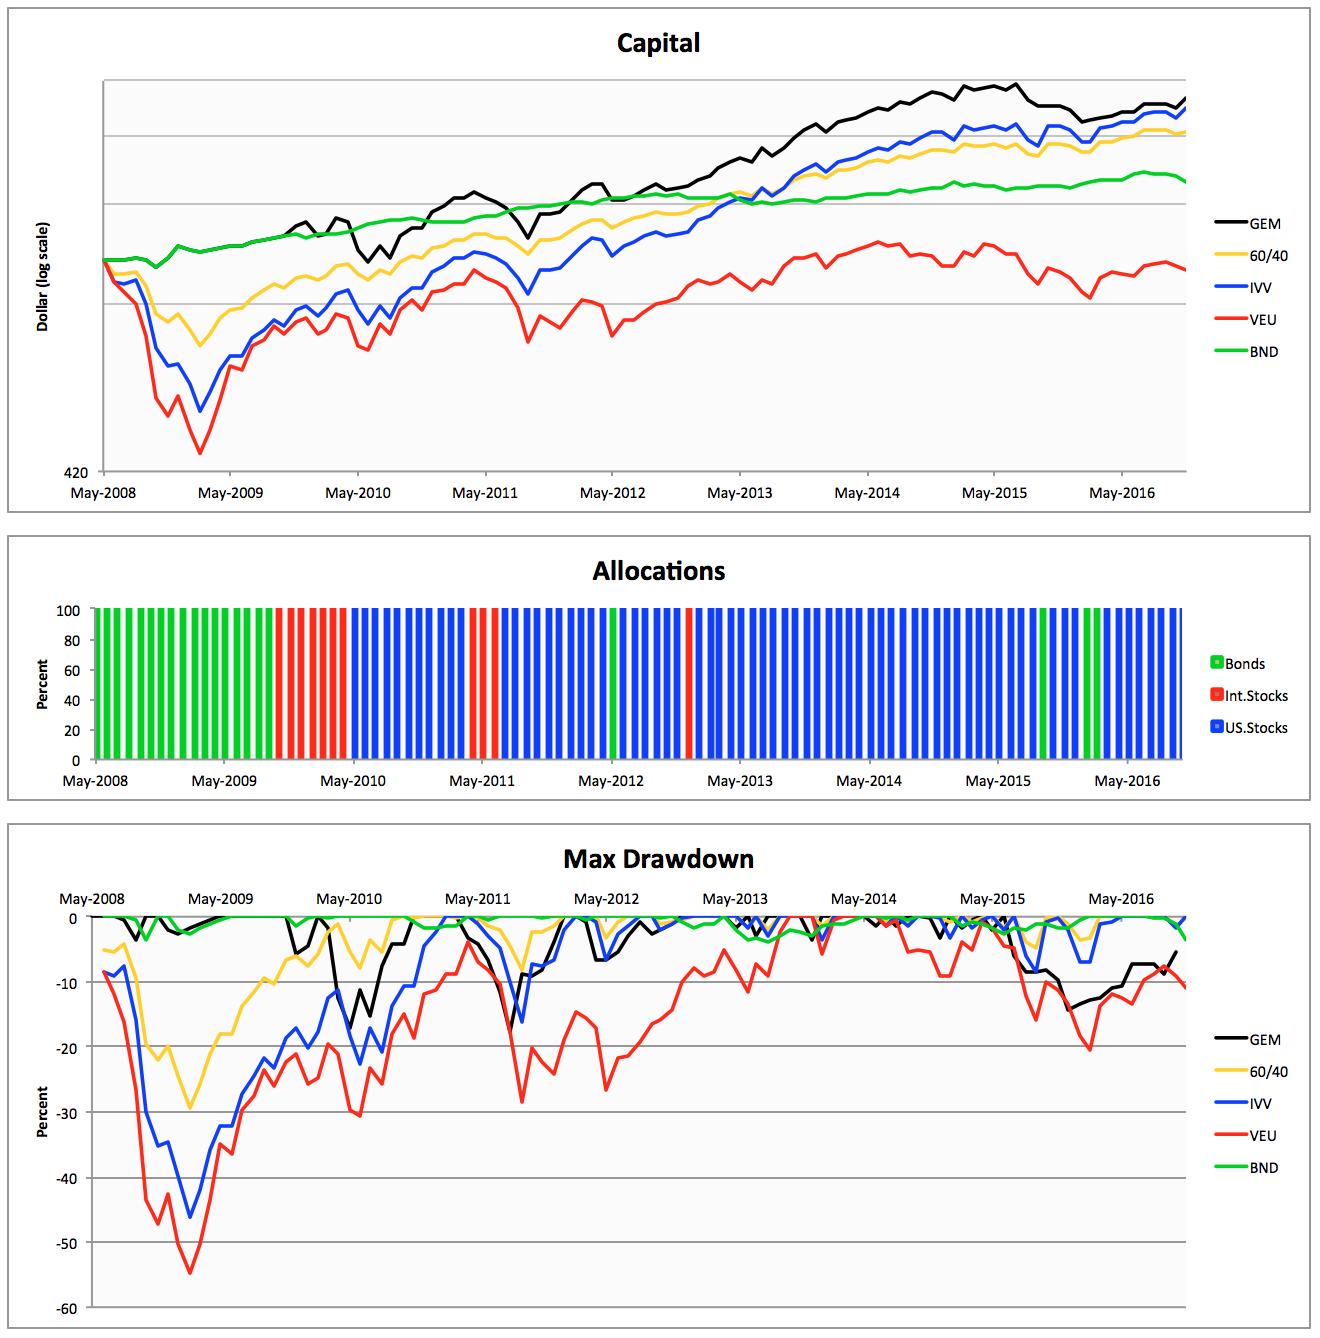
  • Using simulated ETF data series, GEM’s performance over past market conditions can be approximated.
  • For longer investment horizons GEM’s implementation with ETFs obtained positive returns with high consistency.
After winning first place in 2012 in the NAAIM Wagner competition, Gary Antonacci popularized his momentum investing approach in the award winning book “Dual Momentum Investing”.


In his book Antonacci makes a strong case for combining relative strength price momentum with trend following absolute momentum. The first 90 pages are a comprehensive overview, introducing the “premier market anomaly”,  describing the history of momentum research and its early practitioners, behavioristics and lots of other interesting themes. Frankly, these pages alone make the book a must read, not least due to the conversational, at times even playful tone of Antonacci’s light pen.

At the center of the book lies the chapter covering Global Equities Momentum (GEM), where Antonacci explains the mechanics of the dual momentum approach for dynamic asset allocation. GEM is quite brilliant in its simplicity: a 12-month lookback for both absolute and relative momentum combined with just three asset classes, are all of GEM’s components.

Both in his book and on his website, Antonacci presents the Global Equities Momentum (GEM) approach with non-tradable total return index data. Going back as far as the seventies has the benefit of incorporating a rising yields decade too. Therefore, to get insight into GEM’s long-term performance with today’s ETFs, index based simulated total return proxies are required. By applying GEM’s dynamic asset allocation to such simulated ETFs, the practitioner may get a good impression (nothing more) of GEM’s “real” performance during past market conditions. Before doing so, first GEM’s performance with index data will be replicated to validate the accuracy of the presentation in this contribution.

Noteworthy, the rules often shared for GEM, derived from the flow chart on page 101, are not the official GEM rules. Actually the flow chart along with the corresponding instructions on page 112 is only a simplified way to determine GEM’s allocations for those using a website like PerfCharts to get their signals. However, when doing calculations with a charting program like AmiBroker, the instructions on page 98 are to be adhered instead.

AllocateSmartly


Launched only recently, AllocateSmartly.com tracks the industry’s best tactical asset allocation strategies with thorough, up-to-date backtests. As of writing 16 (sub) strategies are tracked and benchmarked on near real-time basis. All of the tracked strategies are both quantitative and systematic, meaning well-defined mathematical rules govern exactly when and what to trade. Among the featured strategies are GEM, GTAA, EAA and PAA. Take the platform for a test drive with a free limited membership or sign up for full membership to access all the neat features.


Disclaimer: Signing up to AllocateSmartly.com through my blog provides support for my work.

Deciphering Correlation Hedged Momentum

In a new SeekingAlpha contribution we combine PAA’s protective multi-market breadth approach with a generalized momentum metric based on correlation hedged returns. The resulting model is called Generalized Protective Momentum (GPM). In this blogpost the correlation hedge is deciphered.


The correlation hedge is a simplified version of Keller and Butler’s EAA-formula (see paper or primer). For GPM we only use return and correlation information as momentum metric. We do so with two variations:
  • GPMxM: the correlation multiplied return metric ri * ( 1 – ci )
  • GPMxF: the correlation fractioned return metric ri / ( 1 + ci )
where x is the degree of crash protection, ri is the average return of asset i over 1, 3, 6 and 12 months, and ci the 12-month correlation of asset i with the equal weighted “risky” investment universe. The correlation multiplier ( 1 – ci ) is based on the EAA-model, the correlation fraction 1 / ( 1 + ci ) was recently suggested by Wouter Keller. For the mechanics of the crash protection algorithm, see the PAA-post.

In the graph below, the two correlation hedge variations are painted.


Introducing Protective Asset Allocation

Protective Asset Allocation (PAA) is a new provident long only tactical investment strategy that combines a dual momentum approach with a vigorous capital preservation routine. The key elements of PAA are:
  • dual momentum based timing and selection mechanism
  • innovative c(r)ash protection routine through protective momentum
  • support for separate “risk-on” and “risk-off" universes
Each of these building blocks will be explained quite comprehensively followed by a detailed comparative backtest covering 45 years (Dec. 1970 – Dec. 2015). But first be ready for a truckload of conceptual particularities ;-)


In our quest for a yield neutral absolute return performance strategy Wouter Keller and I developed PAA (long only) with its innovative protective momentum approach for capital preservation in times of market turmoil. The interested reader might consider reading our PAA-paper on SSRN too.

PAA exploits the well-defined momentum phenomenon: the empirically observed tendency for asset prices to keep moving in the same direction. By applying PAA to a broad diversified global universe of sufficiently uncorrelated ETFs, PAA will auto-detect bull trends that emerge. Meanwhile protective momentum keeps guard over global market-breadth to adjust the “equity” : “cash” spread of the portfolio. And when trends shift, PAA catches the change and adapts, be it bullish or bearish. In doing so PAA is purely mechanical, so there is no need second guessing market conditions nor predicting trends. PAA is capable of delivering absolute return performance with 1-year-rolling-return win rates of more than 95% (R1yWin>0%) and 99% (R1yWin>-5%).

Equity chart of the PAA strategy demonstrating high return/risk performance

Portfolio Level Monte Carlo Analysis

Following up on the prior Strategy Stress Testing post: with the release of AmiBroker version 6.10.0 a new Monte Carlo mode has come available for simulating portfolio equity changes. Instead of randomizing the trade list, the new mode uses bar-per-bar percent equity changes at the portfolio level to generate permutations. Consequently cross-sectional correlations are preserved. According to AmiBroker’s developer, the new method is perfectly fine for multiple overlapped positions, provided the number of bar-per-bar equity changes is sufficiently large (> 100).


The portfolio level Monte Carlo simulation is controlled by a couple of new SetOption fields which allow for AFL implementation right into the strategy code:
The Monte Carlo Portfolio Analysis code is suitable for copy/paste inside a rotational model like the familair Simple GMR code attached to the prior Monte Carlo post. However, my preferred method is to save the code as a separate file for inclusion in strategy models by calling the #include command:

Lab Announcement


After spending ages on research a couple of exciting new developments will be published shorty:
  • Portfolio level Monte Carlo analysis
  • DIY global multi asset universe with 21 ETF-proxies covering a history of 45+ years
  • “One-Click” export from Excel to multiple csv (in R)
  • Enhanced c(r)ash protection routine for tactical investment strategies
  • Dual universe support for differentiation of risk-on and risk-off assets
  • Surveying volatility driven dynamic lookback indicators